This is the report of my MRes short project.
Supervisors: Andy Anderson, Alan Johnston, Peter McOwan
Introduction
It has been well established that the pattern of colouration on many animals is adaptive and confers a survival advantage by concealment, from either predators or prey. The first section of this report reviews different general camouflaging strategies to evade visual detection. The second section discusses different models for explaining the mechanism of neural computation in the visual system. Both edge detectors and motion detectors are treated in detail. Section 3 examines two examples where the camouflage system appears to be exploiting a specific feature of the observer’s visual processing pathway.
Section 4 begins the investigation into optical illusions designed specifically as novel methods of masking movement. Several different active camouflage strategies are discussed, including minimisation of apparent motion, and percepts of accelerated or retarded velocity. These illusions are run through a programme simulating the action of the Multi-channel Gradient Model of motion perception to obtain an objective quantification of the perceptual effects. Section 5 addresses the question as to whether these illusions are employed in nature to disrupt motion perception. The common cuttlefish, along with other cephalopods, produces a characteristic kinetic pattern that may represent an adaptation to generate the motion illusions examined in this research. Two alternative hypotheses for the function of the display are discussed, both of which are novel to the best of the author’s knowledge.
Mathematica programmes were written to generate the designed motion illusions, graph the output from McGM simulation as radar plots, and also to produce several of the diagrams in this report.
1. Aspects of Camouflage
Cott (1940) wrote the seminal paper on animal camouflage and identified several combinable methods, among them cryptic, disruptive, mimicry and countershading. Ender (1986) defined five characteristic stages of predation: detection, identification, approach, subjugation, and consumption. Adaptations against detection and identification; approach; and subjugation and consumption have been named primary, secondary and tertiary defences, respectively.
Cryptic patterning avoids detection whereas disruptive systems are often conspicuous but hamper identification. Confusing, shocking or deimatic signals, such as butterflies flashing large eye-like patterns on their wings, are appropriate during the predator’s approach phase, although are not strictly modes of camouflage. There is evidence that an animal’s perception of its own conspicuousness influences the decision to remain camouflaged or flee when a predator enters the approach phase1. Many camouflage methods are, of course, also applicable to predators aiming to avoid detection by their prey.
The efficacy of a camouflage scheme depends as much on the optical properties of the environment as the visual system of the observer. There exists a co-evolutionary arms race between a prey’s camouflage and neurophysiology of the predator’s visual pathway. If the predator adapts and the match becomes imperfect then the camouflage can be broken, and the prey is under a renewed selective pressure to evade detection. To give a human example, it was noted during World War Two that partially red-green colourblind observers were superior at spotting camouflaged positions. If the tank, for example, slightly contrasts with a forest background in the blue-yellow channel, but matches well in luminance and the red-green channel then it is invisible to a normal observer. Deuteranopiacs, however, are largely insensitive to red-green information so rely proportionally more on the other channels, and can spot the anomaly2. Two examples where the camouflaging scheme seems to have adapted to exploit a specific feature of the observer’s visual processing pathway are discussed in Section 3.
1.1 Cryptic
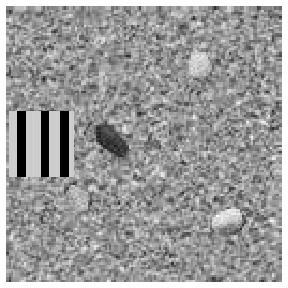
Cryptic colouration renders the bearer difficult to detect by emulating the immediate visual background. The colouring, size, and distribution of pattern elements must necessarily be in aspects pertinent to the visual system of the observer, such as light intensity- or wavelength-sensitivity, or visual acuity. Ideally, the camouflage should represent a random sample of the background at the place and time of highest predation risk3.
The difference in luminance between upper- and under-surfaces due to overhead illumination can betray camouflaged animals. This is often compensated for by countershading: the upper surface is coloured darker than the lower so that the organism appears optically flat when illuminated from above. In addition, if the animal is viewed from beneath then the pale underside merges with the sky, and from above the topside merges with the ground. Species of Cephalopoda, including the common squid, have been found to use their active camouflage to adaptively countershade during rolling4. Even a white undersurface can create a strong silhouette when viewed against a bright sky, and some marine species, such as the pony fish (Leiognathidea family), address this intensity contrast by controllably emitting bioluminescence from their underside5.
A good method of accurately matching the background luminance and colour is to be transparent, or at least translucent. This system has the advantage that it is background and viewing angle invariant, and also matches luminance to diminish silhouetting. Luminance matching can also be achieved with mirrored surfaces. This simple form of camouflage can be broken, however, by predators with polarisation-sensitive visual systems. The aligned fibres of muscle and reflective surfaces both partially linearly polarise light6,7 and impart a conspicuous tell-tale signature against the background. This can be used by predators with polarisation-sensitive visual systems, such as squid, octopi and cuttlefish7, to break the camouflage.
1.2 Disruptive
Disruptive systems of camouflage merge well with the background along some parts of the periphery and so are inconspicuous. Other areas contrast highly and draw the observer’s attention to less essential areas of the animal’s form. Adjacent distracting marks are complex to give the appearance of an assembly of separate objects rather than one contiguous surface. This has the effect of breaking up a prey’s characteristic outline and so reducing the probability that it is recognised as an edible item. ‘Dazzle camouflage’ was adopted by Allied shipping during the First World War, as disruptive patterns were believed to hamper the estimation of a ship’s course, speed and range through the periscope of U-boats8.
2. Computational Visual Processing
This section focuses on the mammalian visual system as it is well studied. The principles, if not exact processes, herein are thought to be evolutionary conserved, however, and are likely to be similar between disparate species.
A monolayer of photosensitive receptor cells line the retina so the visual field can be treated as a two-dimensional map of receptor activations. Many artificial models of the visual system simplify the situation, ignoring the blue-yellow and red-green colour channels, and consider only luminance (light intensity). The information content at the lowest level of these simulations of the visual processing pathway is thus an array of brightness values. The visual system is hierarchical, with each level performing a simple computation on the output passed to it from lower levels. It is also combinatorial, and separate information channels are combined in different ways to reveal particular features in the visual field. Standard mathematical operations such as addition, multiplication, and division are believed to computed at a neuronal level, and from these more complex functions like differentiation, integration, smoothing, and thresholding are constructed. Thus, a set of increasingly sophisticated detectors are built, which find features such as luminance gradients, edges, bars, object peripheries, position in 3D space, orientation, motion speed and direction, and so on. The components most relevant to breaking the modes of camouflage discussed in Section 3 are edge detectors and the higher-level motion detectors.
2.1 Image Operators
An early theory of the mechanisms behind visual perception was proposed by Marr (1982)9. He stressed the hierarchical nature of visual processing, with the local changes in the intensity map, or features, firstly made explicit, and then the identification of larger regions and structures composed of these features. A series of image operators work on the output from the level below to progressively compute a primal sketch of the salient features within the visual field. Image operators, or filters, can be built from cells with receptive fields with both inhibitory and excitatory regions. For example, the odd-symmetric double-lobed filter shown in Figure 1 produces maximum output when it is positioned astride the step edge. This filter effectively calculates the local gradient, dI/dx (first derivative), of the intensity profile. Alternatively, a second derivative operator would reveal an edge where its value is zero, a ‘zero-crossing’, corresponding to a peak or trough in the gradient. The shape of such filters are even symmetric three-lobed receptive fields.
The problem is further complicated by noise, and that edges can occur in any orientation and appear at a range of spatial scales. An array of differently-orientated filters (known as a Canny detector) is needed to detect edges in all directions. Another solution is to use a filter with a single circular field. The Laplacian, or ‘del-squared’, filter is such a non-orientated 2nd-derivative operator, formed from the summation of two orthogonally orientated two-lobe filters. Local measures of gradient are vulnerable to noise, and so smoothing functions are used to average out small-scale intensity variance. The ‘del-squared-G’ operator combines the Laplacian edge-detector with the smoothing properties of the Gaussian function, and is the basis of the Marr & Hildreth model. Graphs of the Gaussian, first and second derivatives, and del-squared-G functions can be seen in Figure 1. Edges also occur at different spatial scales, from sharp steps to wide blurs with shallow intensity gradient. To detect an edge filters must therefore also be tuned to a particular size, requiring multiple filters from coarse to fine scale.
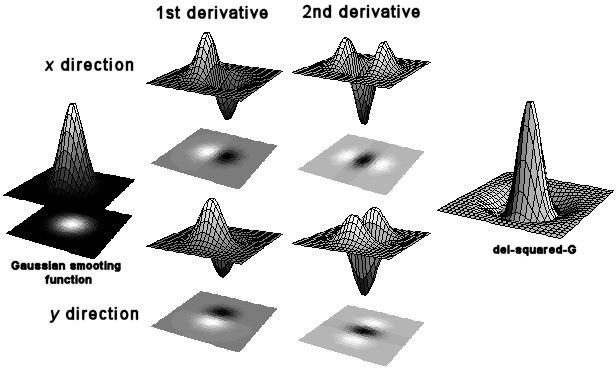
Figure 1. The Gaussian smoothing function with 1st derivative operators as odd-symmetric double lobed receptive fields and 2nd derivatives as even-symmetric triple lobed receptive fields. Partial derivatives with respect to x and y give receptive fields orientated perpendicularly to each other. The summation of two 2nd derivative operators yields the del-square-G operator with a centre-surround receptive field combining both smoothing and differentiation functions. All graphs produced in Mathematica by the author.
2.2 Contrast energy model
The Canny and Marr & Hildreth models rely on even-symmetrical receptive fields, which are unable to distinguish between the responses caused by edges and bars. An alternative theory, the contrast energy model, uses the output signal from similarly orientated odd [o(x)] and even [e(x)] filters. The energy function E(x) is defined as:
E2(x) = e2(x) + o2(x)
which is always positive, and shows a high output when o(x) or e(x) or both are high (i.e. analogous to an OR logic gate). The energy peak flags the location of a feature which can then be identified by inspecting the odd and even filter outputs. If e(x) has a peak the feature is a bar, if o(x) has a peak it is an edge. Thus ambiguity in filter response has been overcome.
Intensity variance is thus decoded into features such as edges, bars (two nearby edges of opposite sign), terminations and blobs, depending on the type of intensity change. The next stage is the recursive grouping of these features into associated aggregations, based on proximity or orientation.
2.3 Motion detectors
Motion is a change in position within the visual field between successive time steps, and so can be conceptualised as a three-dimensional volume. Figure 2 shows the passage of a square across a static background in this format. If the volume is cut horizontally the resultant space-time plane, I(x,t), represents the traverse of a single row of the square over the background, as shown in Figure 3.
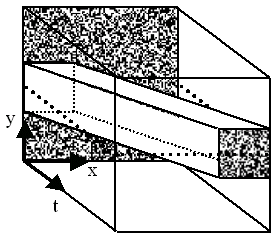
Figure 2. Motion conceptualised as a path through a spatiotemporal volume. A slice is made along the dotted line. Diagram constructed by the author.
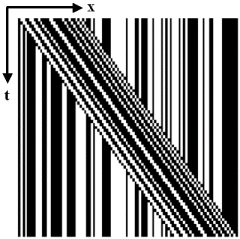
Figure 3. An I(x,t) plane showing the traverse of the square. Diagram constructed in Mathematica by the author.
Every point in this row follows the path defined by the linear equation:
x(t) = x0 + V.t
where x0 is the initial x position, V is velocity and t is time. The faster the motion, the steeper the gradient of this path.
In Reichardt’s correlation model, the output of two spatially separated receptors are multiplied (a non-linear operation). One of the outputs is delayed so correlation (coincident impulses) occurs if the moving stimulus is of a given direction and speed. This simple model requires many detectors tuned to different speeds, and has problems of aliasing and phase dependence.
If velocity is thought of as an orientation in space-time it can be measured analogously to orientation in x-y; by the ratio of temporal and spatial derivatives:

This is the basis of gradient models of velocity coding. In regions of constant luminance the intensity gradient (denominator) will be zero, and the above equation will be ill-conditioned. One solution is to use multiple channels of higher derivatives (i.e. take a truncated Taylor expansion about the point), since the more derivatives used the lower the chance that all will be zero at the same time. This more robust measure of velocity, known as the Multi-channel Gradient Model (McGM), uses not one ratio but a least squares approximation (line of best fit) of the derivatives.
An alternative model is similar to the contrast energy mechanism of edge-detection. The motion energy model uses two sets of orientated detectors (e.g. leftwards and rightwards), each composed of an odd and an even filter. The leftwards energy is calculated by summing the squared output from the two leftwards filters, and conversely for the rightwards energy. The opponent energy is the difference between the two motion energies, which is then normalised by dividing by the static energy (to remove contrast sensitivity) to give an estimate of velocity.
The detection of certain stimuli cannot be modelled by the energy system and they are termed ‘second order’, or non-Fourier, motion. Such stimuli create no structure in the luminance profile and instead involve modulation of local contrast, spatial density, or flicker rate. They can be observed by humans as ascertained by psychophysical experiment. The McGM can detect this motion, as well as avoiding the energy model’s necessity for contrast normalisation and population coding.
3. Camouflage and the Visual System
Animal camouflage can now be reworded in terms of the visual processing system. Countershading minimises the intensity gradient down an animal, so that it is detected only be the largest scale first derivative filters, if at all. Silhouette masking techniques, such as that employed by the pony fish, minimise the contrast between self and surroundings to escape edge-detection.
Cryptic camouflage must match the background not just in luminance, but also in all colour channels relevant to the predator, in order to escape detection by the edge or bar-sensitive receptive fields. The overall pattern must also correlate or the higher-level texture detectors would break the camouflage. Disruptive patterning on the other hand is deliberately partly conspicuous so that some regions stand out to the predator’s edge detectors. These distracting marks become grouped together (by the aggregation algorithms mentioned above) into a form that does not resemble the outline of the prey, and a predator’s image-matching technique fails to detect it.
This section will now deal with two animals that appear to have evolved specific adaptations, one physiological the other behavioural, to evade edge and motion detectors.
3.1 Deceiving edge detectors
Osorio & Srinivasan (1991)10 present evidence that some cryptic patterning has evolved to exploit a very specific feature of a predator’s visual system. The Australian frog, Limnodynastes tasmaniensis, utilises border enhancement, with the edges of pigment regions sharply demarcated with adjacent narrow black and white bands, as seen in Figure 4. Its main predation threat is from snakes and birds. Frogs signal vocally so it is assumed that the primary function of this colouration pattern is concealment, and not high visibility for mate attraction. They do not serve as an aposematic warning as the Australian frog is non-toxic, and it is not thought to be a Batesian mimic as poisonous species do not possess enhanced border patterns. It is believed, therefore, that these markings have evolved to directly effect a predator’s visual system, specifically by super-exciting edge detectors. The high contrast contours must be perceptually indistinguishable from ‘natural’ step edges to the predator’s visual system, otherwise they would provide a distinctive ‘prey signature’ for the snake to target. As explained above, there exist several models on the system of filters used for edge detection, and this final constraint allowed Osorio and Srinivasan10 to deduce which is probably utilised in the snake visual system.
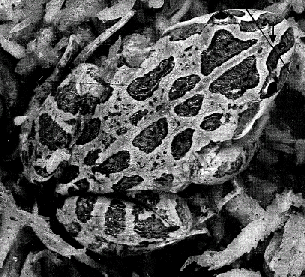
Figure 4. Australian frog showing border enhancement. Taken from Osorio and Srinivasan (1991)10
The intensity profile of the enhanced edge is compared to that of a natural step edge in Fig 5(a). The different detectors produce distinct outputs when presented with the natural step edge and enhanced contrast edge, as shown in Figure 5(b). Both the Canny and Marr & Hildreth detectors respond differently to the two edges, with the enhanced profile producing prominent ‘secondary responses’. They are able to distinguish between them, and therefore can break the frog’s camouflage. The energy model, however, is super-excited by the enhanced edge yet produces no secondary responses so is unable to distinguish it from a natural step edge. The deception is robust over a wide range of spatial scales (corresponding to variance in pattern size, viewing distance, or predator visual acuity). Osorio and Srinivasan concluded from this that the snake’s visual system employs contrast energy edge detectors, otherwise the enhanced edge broken camouflage would be under strong negative selection.
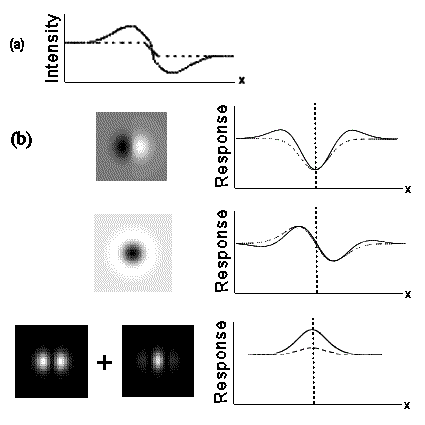
Figure 5. (a) Intensity profiles of enhanced (bold line), and natural step edge (dashed line). (b) Response to the enhanced (bold line) and step edge (dashed line) from different detectors; Canny model (top), Marr & Hildreth (middle) and contrast energy (bottom). Figure adapted from Osorio & Srinivasan (1991)10.
3.2 Deceiving motion detectors
Animation 1. Conspicuousness of a camouflaged object due to motion.
Even perfect cryptic camouflage is betrayed by movement, and many predators stalk extremely slowly. The visual system is very sensitive to motion and can aggregate features by common fate. Animation 1 shows this effect; the square is invisible until it starts moving. Refer back to Figure 3 for the space-time diagram of this motion. All animations in this project were produced by the author inMathematica. An example of the code can be found in Appendix I.
If motion reveals a camouflaged animal then it would be reasonable to expect natural selection to have developed mechanisms for reducing this apparency. Moving slowly to minimise optic flow does not work when hunting fast-moving prey.
Following observations of hoverfly flight paths Srinivasan (1995)11 described a strategy for motion camouflage, which has since been demonstrated in ‘dog fighting’ male dragonflies12. If an animal is able to maintain its position on a constraint line linking the moving target and a distant point its image does not move over the target’s retina. The illusion of zero apparent motion is created and the pursuer can mimic a stationary object located at the convergence point. See Figure 6.
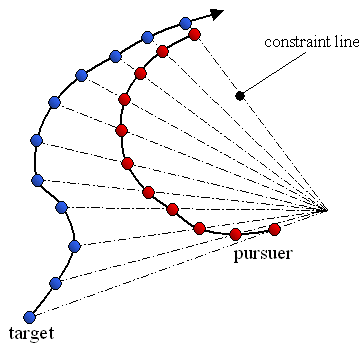
Figure 6. Flight paths of a target (blue) and its pursuer (red). The pursuer is using motion camouflage to mimic a stationary object positioned at the point of convergence of the constraint lines. Diagram produced by the author.
The pursuer can optimise different criteria, such as minimising total distance flown before interception or relative speed of approach, as it moves along the constraint lines13. Ideally the pursuer would also be camouflaged against the background surrounding the fixed point. Srinivasan11 provided computationally simple algorithms to generate this behaviour with the sensory information and flight control thought to be within insect capabilities. Anderson has also shown that humans are deceived by this stealth strategy14.
This research project is concerned with investigating a novel stealth strategy for disguising movement.
4. Novel motion camouflaging strategies
As seen in Animation 1, a region of common velocity is readily perceived as a unit and stands out against a static background. The outline is stark (although the lines and angles of a square are rare in nature) and during motion disruptive patterning would not escape a predator’s search image. One method of reducing this motion cue is to actively alter skin pigmentation to create a pattern flowing backwards at the same rate as actual forward motion. The two velocities cancel out and the texture appears stationary. Animation 2 demonstrates this illusion, and the space-time diagram in Figure 7 shows the problem that motion detectors face.
Animation 2. Active camouflaging to reduce perceived motion.
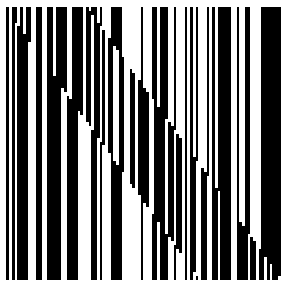
Figure 7. Space-time diagram of actively camouflaged square motion
There is no net movement within the square region and so the trajectory though space-time contains only vertical stripes. There is thus no change in intensity over time (δI / δt = 0 ), and motion detectors relying on spatiotemporally-orientated receptive fields only see two stationary regions. Only at the boundary of the trajectory is there any contrast, which corresponds to the conspicuous flicker perceived at the leading and trailing edges. This is due to the square boundary occluding the background, and can be explained by adapting an argument from Johnston et al (1999)15. At arbitrary time t0 the rightmost column of the square texture is adjacent to a random column of the background. Next time step the square advances but the texture recedes so that the column remains unchanged, but is now adjacent to a new rightmost column of texture. Thus, within the motion detector receptive fields over this boundary the left-hand column is temporarily static and the right-hand one is effectively randomised. As Figure 8 shows, the motion detectors are still able to extract accurate velocity information along this occluding boundary despite the randomisation. Although most of the possible transitions result in no motion being detected, twice as many accurately identify left-to-right (positive values) motion as erroneous motion signals (negative values). Along a boundary of 100, or more, pixels these few accurate signals will give an overall percept of rightwards motion along the leading edge. The leading and trailing edges are very apparent to the McGM programme, as seen in Table 1, presumably due to this mechanism.
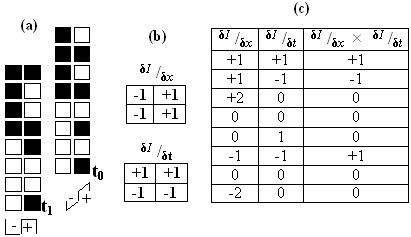
Figure 8. (a) As the square advances from t0 to t1 the left-hand column remains effectively static and the right-hand column swaps from a column of the background to the new rightmost column of the square texture. In this example the pixels are not in fact random, but a list of all eight permutations to demonstrate the output of the filters in all possible scenarios. (b) The simplified space- and time-derivative filters used to model the output of motion detectors positioned over the two columns. A white pixel has luminance value 1, and black 0. (c) Responses from the two filters, and their product. A positive value indicates left-to-right motion, and negative right-to-left. Diagram produced by the author.
The distinction between this novel mode of motion camouflage and that commonly discussed in terms of military application should be stressed. Tanks with an optically active skin would be able to constantly update the displayed pattern so as to maintain a match with the background. Cephalopods16, and to a limited extent flatfish and chameleons, are routinely observed doing this. The strategy that this paper proposes is using a pattern flowing with a specific rate and direction in order to disguise the effect of motion itself, as opposed to updating camouflage in response to a change in background as a consequence of movement.
Animation 3. Accelerated percept
An alternative to disguising the velocity field created by motion is to accentuate it. Animation 3 displays the optical illusion generated when the square’s texture flows in the same direction as actual motion. The resultant velocity field of the square is twice that of actual movement, and the percept is of accelerated motion.
If instead the texture flows backwards faster that the square advances (i.e. an overcompensation for movement) then the perceived velocity of the square would be predicted to be reduced. This is indeed the observed effect, as seen in Animation 4, where the reverse flow is three times the rate of actual forwards motion.
Furthermore, if the direction of texture flow is orthogonal to motion the animation generates transient percepts of diagonal motion (direction deflection). The illusion is strongest if the head is tilted slightly. See Animation 5.
Animation 4 Retarded apparent motion.
Animation 5 Percept of diagonal motion produced by perpendicular flow.
In addition to subjective impressions of the illusory effects, these animations were analysed with a Visual C++ programme simulating visual perception using the Multi-channel Gradient Model. At each time step the programme calculates the velocity vector of every pixel in the frame using the method of ratio of higher-order intensity derivatives of the McGM. The vectors are displayed as two arrays, one of magnitude the other of direction. The vectors were also averaged over the entire animation, and then displayed as scaled sectors orientated in the appropriate direction. The programme to perform this data manipulation and construct the ‘radar plots’ was written by the author in Mathematica. The results of the nine analysed animations are displayed in Table 1.
The salient points, summarised in Table 2, are that as the rate of rearwards flow increases the perceived backwards velocity increases, as shown by both the magnitude display and radar plot (with a growing signal in the rearward sectors). The converse was found to be true for increasing forwards flow, also as expected. The simulated Passing Cloud pattern produces an astounding response. Even though it flows at a rate of only 1x, the bold stripes generate a very strong percept of accelerated forward motion, as gauged by the intensity of the vector magnitude and direction plots. The radar plot is also vastly different from the time-averaged perceived motion vectors of the passive camouflage square, with prominent spikes in the fore, aft and down directions.
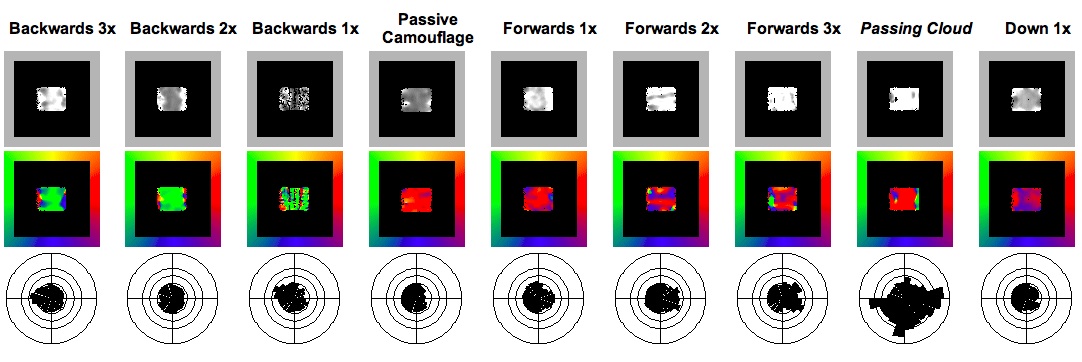
Table 1. Output from McGM. First row: magnitude of perceived velocity vector in one frame (intensity coded from black to white). Middle row: direction velocity in one frame (colour-coded as per the colour wheel border). Bottom row: radar display of velocities averaged over entire time sequence. Magnitudes in top and bottom rows in arbitrary units
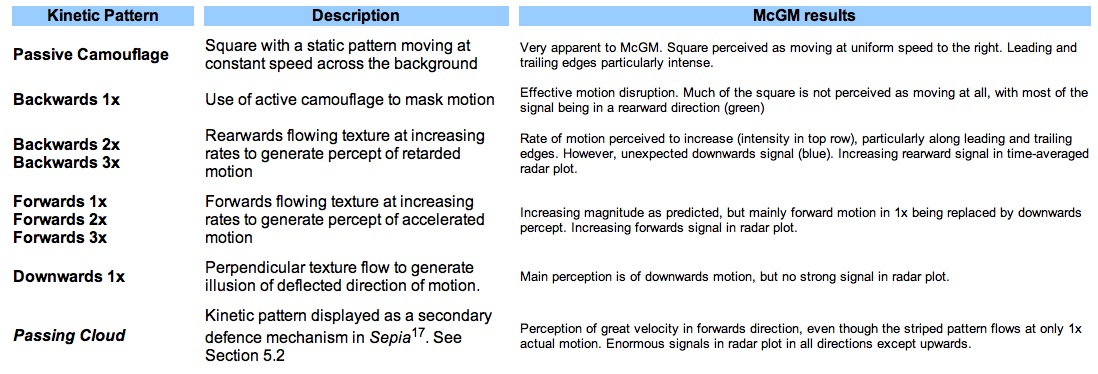
Table 2 Notes to the results collected in Table 1.
5. Two novel explanations for a cuttlefish display
Table 1 provides an objective quantification of the illusionary effects that were predicted before the animations were created. The output was from a simulation using the McGM, but presumably animal visual systems that operate on similar principles would also experience these illusions. There may, therefore, be a selective advantage to employing these forms of camouflage. Disrupting the calculation of motion has obvious survival advantages. As a secondary defence, a backwards kinetic pattern would give the appearance of slower escape than in reality, and a predator’s attack may be mis-targeted. This would also hold true for forwards-flow, with the added benefit that a pursuing predator may break off the chase if it perceives the prey to be escaping too quickly.
5.1 Biological examples of active camouflage
Several classes of animals are able to actively alter their bodily pigmentation. Flatfish and chameleons are examples, but cephalopods, including squid, octopi, and cuttlefish, have particularly sophisticated active camouflage systems.
The common cuttlefish, Sepia officinalis, has the greatest repertoire of patterns, classified into 13 broad categories17 with functions including cryptic and disruptive camouflage, deimatic warnings, and sexual displays. Adults possess two million pigment-filled chromatophores in three colour classes; yellow, orange and brown, that are layered at increasing depth in the dermis and so overlap when dilated. These are combined with the iridescent colours of iridophores and leucophore reflecting elements that control the degree of surface luminance to produce an enormous diversity of colour hues and patterns17. Each of these cells is under direct motor neurone innervation from the brain and so patterns can be changed extremely precisely and swiftly (in under a second).
Given that cuttlefish can accurately emulate the substrate by adaptively and rapidly altering patterning it is reasonable to suggest that they are physiologically able to produce the Backwards 1x flowing pattern that would disguise motion. No observations of kinetic patterns similar to this have been reported, but Sepia do produce a display, known as “Passing Cloud” with very interesting properties.
5.2 Passing Cloud
Passing Cloud is defined by Hanlon and Messenger (2001)17 as a secondary anti-predator defence and described as follows:
“A kinetic pattern, lasting only a second or two, characterized by broad transverse bands of chromatophore expansion moving rapidly forward from the posterior mantle tip across the dorsal body surface to the anterior tip of the arms”
This is exactly the kind of kinetic pattern that this research has demonstrated would disrupt the accurate assessment of velocity. Secondary defences are initiated when the prey has already been detected and identified, and the predator is now in the third stage, approaching for attack. This is a time a time when maintaining crypsis would be of limited value. Hanlon and Messenger (2001)17attribute the pattern only as a “rapid colour change that confuses the predator”, but a more specific function may be to generate the illusion of a greater rate of escape. The thick, high contrast stripes are very conspicuous and would elicit a maximal response from orientated space-time filters. The perceptual effects of this pattern were investigated by testing a simulation of it with the McGM programme. The square’s random texture was replaced with high contrast stripes of thickness and spatial frequency (three per length) similar to the photograph in Figure 9, and the background was replaced with a pattern characteristic of the sea bottom. No data could be obtained on the temporal frequency (flow rate) of the pattern, so for the sake of experimentation it was set to 1x. Animation 6 shows the simulation, and the McGM output can be seen in Table 1.
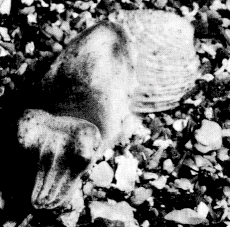
Figure 9. “Passing Cloud” kinetic pattern of Sepia. Taken from Hanlon and Messenger (2001)17
Animation 6. Simulation of Passing Cloudpattern
The pattern does indeed induce an extreme perception of speed (high magnitude vectors directed mainly to the right) even though it is flowing at only 1x actual movement.
Cuttlefish are epibenthic and so spend the majority of the time being viewed from above. This perspective and their flattened bodies provides ideal conditions for the dorsal area to act as a display surface. The impact of kinetic patterns is aspect-dependent, but the cuttlefish’s lifestyle largely constrains the range of viewing angles.
5.3 A second possible explanation of Passing Cloud
Boycott (1958)18 also describes the Passing Cloud pattern, but when the cuttlefish is approaching prey before shooting out its tentacles to capture. A video available online shows a stationary octopus flashing the Passing Cloud display just before it lunges at a prey. It is evident that this pattern may serve a function before the onset of motion. An alternative proposal, that again, to the best of my knowledge, has not yet been suggested, is that Passing Cloud is used to generate a motion after effect (MAE) in the observer’s visual system.
When fixation is transferred to a stationary pattern after observing a moving stimulus, such as a waterfall, illusory motion is perceived in the direction opposite the adapting motion – the motion after effect. The adapting stimulus is believed to cause fatigue in cells sensitive to it, which remain suppressed for some time afterwards, and thus cause a lingering perceptual repulsion effect19. This MAE is known to disrupt the assessment of speed and direction in subsequent moving stimuli, especially incoherent motion, as well as impairing the ability to detect low contrast stimuli19. These details are enormously important during an escape or predatory strike, and so denying the observer this information has undeniable survival benefit. On the basis of the occurrence and form of the Passing Cloud kinetic pattern it is a justifiable supposition that it functions to generate a MAE.
6. Conclusion and Future direction
The importance of a camouflage system matching the optical background is well known, but the interaction with the visual processing pathway of the observer is often overlooked. Two examples where natural selection has seemingly designed the mode of camouflage to exploit a specific feature of the visual system were discussed. Original optical illusions were developed, and their potential application to motion camouflage examined. A well characterised cephalopod kinetic pattern, the Passing Cloud display, can now be viewed in terms of these illusions, and two novel conjectures as to the mode of functioning were given. The display’s simulated effect on a model visual system agreed well with predictions based on its function as a method of generating accelerated perceived motion.
Further research into the Passing Cloud pattern could more rigorously test the accelerated motion or MAE hypotheses. The McGM programme would be used to test different patterns and rates of flow to assess which generates the maximum percept of accelerated motion. Close similarity between this optimum display and the bold stripes of Passing Cloud would support my hypothesis.
Future research could also take a more psychological direction. Humans perceive the square as an object with enhanced or retarded velocity. Stimuli with areas of the square moving with different rates and directions could also be examined. For instance, would a square with the top half generating accelerated motion and the bottom half retarded motion result in an overall percept of rotation? Motion compartmentalisation of the square on a finer scale might generate an effect analogous to disruptive camouflage, where even the outline becomes indistinct and unrecognisable as a square. The more rigorous, yet time-consuming, methods of psychophysical experimentation should be performed on multiple volunteers that quantitatively score the percept.
A more extensive literature review of animals with active camouflage capabilities that may employ motion illusions would also be very informative.
Bibliography
- Anderson, J. & et al. Modular organization of adaptive colouration in flounder and cuttlefish revealed by independent component analysis. Network Computation in Neural Systems 14, 321-333 (2003).
- Anderson, A. & McOwan, P. Humans deceived by predatory stealth strategy camouflaging motion. Proceedings of the Royal Society, B 720, 18-20 (2003).
- Behrens, R. The Role of Artists in Ship Camouflage During World War I. Leonardo 32, 53-59 (1999).
- Boeddeker, N. & Egelhaaf, M. Steering a virtual blowfly: simulation of visual pursuit. Proceedings of the Royal Society, B 270, 1971-1978 (2003).
- Boycott, B. The Cuttlefish – Sepia. New Biology 25, 98-119 (1958).
- Brandt, M. & Mahsberg, D. Bugs with a backpack: the function of nymphal camouflage in the West African assassin bugs Paredocla and Acanthaspis spp.Animal Behaviour 63, 277-284 (2002).
- Bruce, V., et al (ed). Visual Perception, 4th ed (2003).
- Chiao, C. & Hanlon, R. Cuttlefish camouflage: visual perception of size, contrast and number of white squares on artificial checkerboard substrata initiates disruptive coloration. The Journal of Experimental Biology 204, 2119-2125 (2001).
- Clifford, C. & Ibbotson, M. Fundamental mechanisms of visual motion detection:
models, cells and functions. Progress in Neurobiology 68, 409-437 (2002). - Cuadrado, M., Martín, J. & López, P. Camouflage and escape decisions in the common chameleon, Chamaeleo chamaeleon. Biological Journal of the Linnean Society 72, 547-554 (2001).
- Ferguson, G. & Messenger, J. A countershading reflex in cephalopods. Proceedings of the Royal Society, B 243, 63-67 (1991).
- Glendinning, P. The mathematics of motion camouflage. Proceedings of the Royal Society, B 271, 477-481 (2004).
- Grable, M., Shashar, N., Gilles, N., Chiao, C. & Hanlon, R. Cuttlefish Body Patterns as a Behavioral Assay to Determine Polarization Perception. Reports from the MBL General Scientific Meetings, 232-234 (2002).
- Hanlon, R. & Messenger, J. Adaptive Coloration in Young Cuttlefish (Sepia Officinalis L.). Proceedings of the Royal Society, B 320, 437-487 (1988).
- Hanlon, R., Forsythe, J. & Joneschild, D. Crypsis, conspicuousness, mimicry and polyphenism as antipredator defences of foraging octopuses on Indo-Pacific coral reefs, with a method of quantifying crypsis from video tapes. Biological Journal of the Linnean Society 66, 1-22 (1999).
- Hastings, J. Light to Hide by: Ventral Luminescence to Camouflage the Silhouette. Science 173, 1016-1017 (1971).
- Johnston, A., Benton, C. & McOwan, P.
- Johnston, A. & Clifford, C. A Unified Account of Three Apparent Motion Illusions. Visual Research 35, 1109-1123 (1995).
- Johnston, A., McOwan, P. & Benton, C. Robust velocity computation from a biologically motivated model of motion perception. Proceedings of the Royal Society, B 266, 509-518 (1999).
- Johnston, A., Benton, C. & McOwan, P. Induced motion at texture-defined motion boundaries. Proceedings of the Royal Society, B 266, 2441-2450 (1999).
- Judd, D. Colorblindness and the detection of camouflage. Science 97, 544-546 (1943).
- Merilaita, S. Crypsis through disruptive coloration in an isopod. Proceedings of the Royal Society, B 265, 1059-1064 (1998).
- Merilaita, S. Visual Background Complexity Facilitates the Evolution of Camouflage. Evolution 57, 1248-1254 (2003).
- Mizutani, A., Chahl, J. & Srinivasan, M. Motion Camouflage in Dragonflies. Nature 423, 604 (2003).
- Osorio, D. & Srinivasan, M. Camouflage by edge enhancement in animal coloration patterns and its implications for visual mechanisms. Proceedings of the Royal Society, B 244, 81-85 (1991).
- Schultz, T. & Bernard, G. Pointillistic mixing of interference colours in cryptic tiger beetles. Nature 337, 72-73 (1989).
- Shashar, N., Hanlon, R. & Petz, A. Polarization vision helps detect transparent prey. Nature 393, 222-223 (1998).
- Shashar, N., Hagan, R., Boal, J. & Hanlon, R. Cuttlefish use polarization sensitivity in predation on silvery fish. Vision Research 40, 71-75 (2000).
- Srinivasan, M. & Davey, M. Strategies for active camouflage of motion. Proceedings of the Royal Society, B 259, 19-25 (1995).
- Tankus, A. & Yeshurun, Y. Convexity-based Visual Camouflage Breaking. Computer Vision and Image Understanding 82, 208-237 (2001).
- Wright, K. Biomechanics and Behavioral Adaptations associated with Cuttlefish Locomotion. (2002).